Skip to content

Marketplace and quick commerce ads case studies

By Akshit Seth · Last updated 26 October 2026

Each case shows the marketplace or app, the period, the monthly spend band and exactly what changed, before and after. Every client agreed to their case being published.

Illustration of product parcels connected by a glass delivery network.

Amazon

Health & Household

Runaway ad cost eating net margins

52% → 27%TACoS

Results in 120 days

Read the case study

Supplements & Nutrition

New product launch stuck on the back pages

Page 8 → 2core keyword rank

Results in 120 days

Read the case study

Apparel & Accessories

Variations fighting each other and inflating CPCs

−23%average CPC

Results in 90 days

Read the case study

Home & Kitchen

Crushing ad dependency with no organic sales

85% → 50%share of sales from ads

Results in 90 days

Read the case study

Consumer Electronics

Budget bleeding early in the day

+35%ad sales in peak windows

Results in 60 days

Read the case study

More Amazon results

Straight from client dashboards, with brand names hidden.

Amazon sponsored ads performance, 1 Jan to 31 Mar 2026
Jan to Mar 2026: ₹2,34,349 ad spend, ₹9,15,564 sales, 1,182 purchases, ROAS 3.91.
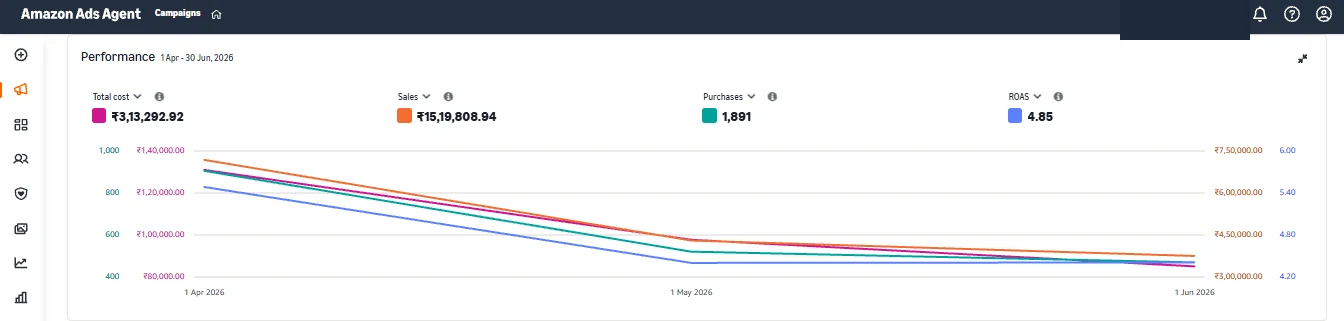
Amazon sponsored ads performance, 1 Apr to 30 Jun 2026
Apr to Jun 2026: ₹3,13,293 ad spend, ₹15,19,809 sales, 1,891 purchases, ROAS 4.85.
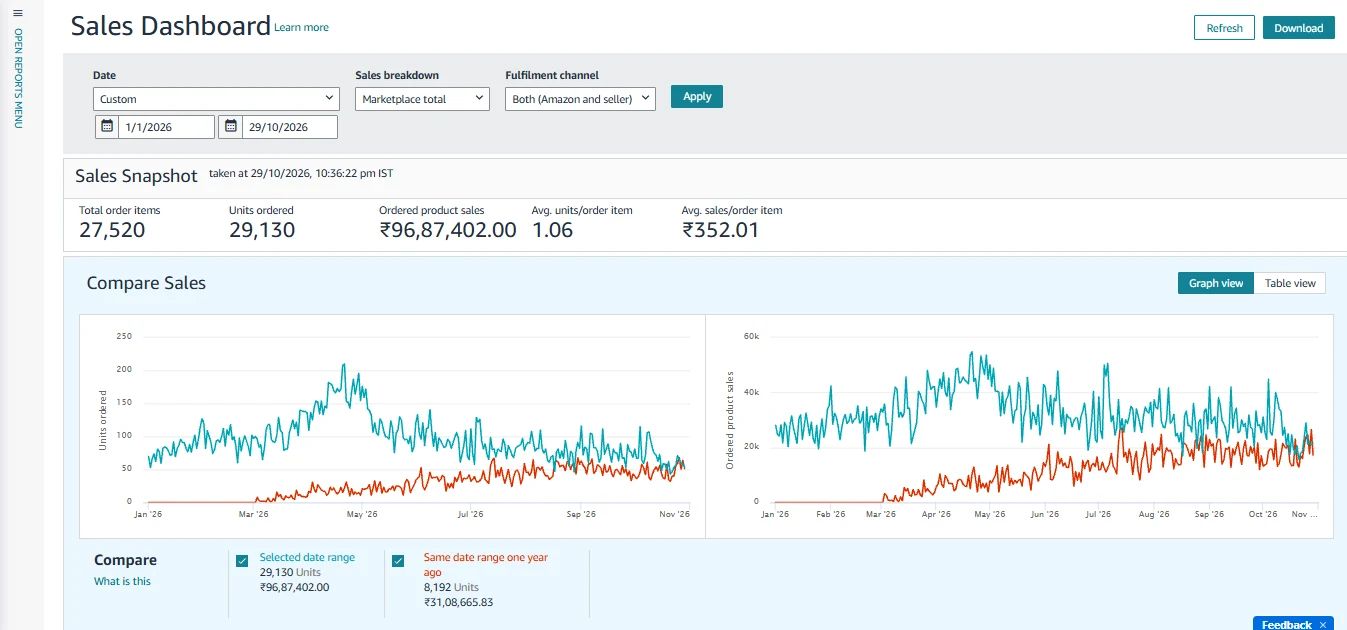
Amazon Seller Central sales dashboard, 1 Jan to 29 Oct 2026, compared with a year earlier
1 Jan to 29 Oct 2026: ₹96,87,402 in ordered product sales (29,130 units), up from ₹31,08,666 (8,192 units) in the same period a year earlier.

Want results like these?

Start with a free ads audit of your own account.

WhatsApp Call Free audit